Connecting JetBrains IDEs
Connect your JetBrains IDE (WebStorm, PhpStorm, etc.) to Workspace Manager workspaces for remote development using SSH-based deployment and remote interpreters.
Overview
Section titled “Overview”JetBrains IDEs support remote development through SSH, allowing you to run your IDE locally while executing code and accessing files on remote workspaces. This provides a seamless development experience with full IDE features running against your remote workspace environment.
Prerequisites
Section titled “Prerequisites”- JetBrains IDE (2021.3 or later recommended)
- SSH access configured (see SSH documentation)
- Workspace running and accessible
- SSH key added to your WSM profile
Supported IDEs
Section titled “Supported IDEs”All JetBrains IDEs with SSH deployment support can connect to Workspace Manager workspaces:
- WebStorm
- PhpStorm
- DataGrip
Configuration
Section titled “Configuration”JetBrains IDEs use SSH deployment to sync files between your local machine and remote workspace, while executing code remotely. This keeps your IDE running locally with full performance while leveraging the remote workspace environment.
Step 1: Configure the SSH Configuration
Section titled “Step 1: Configure the SSH Configuration”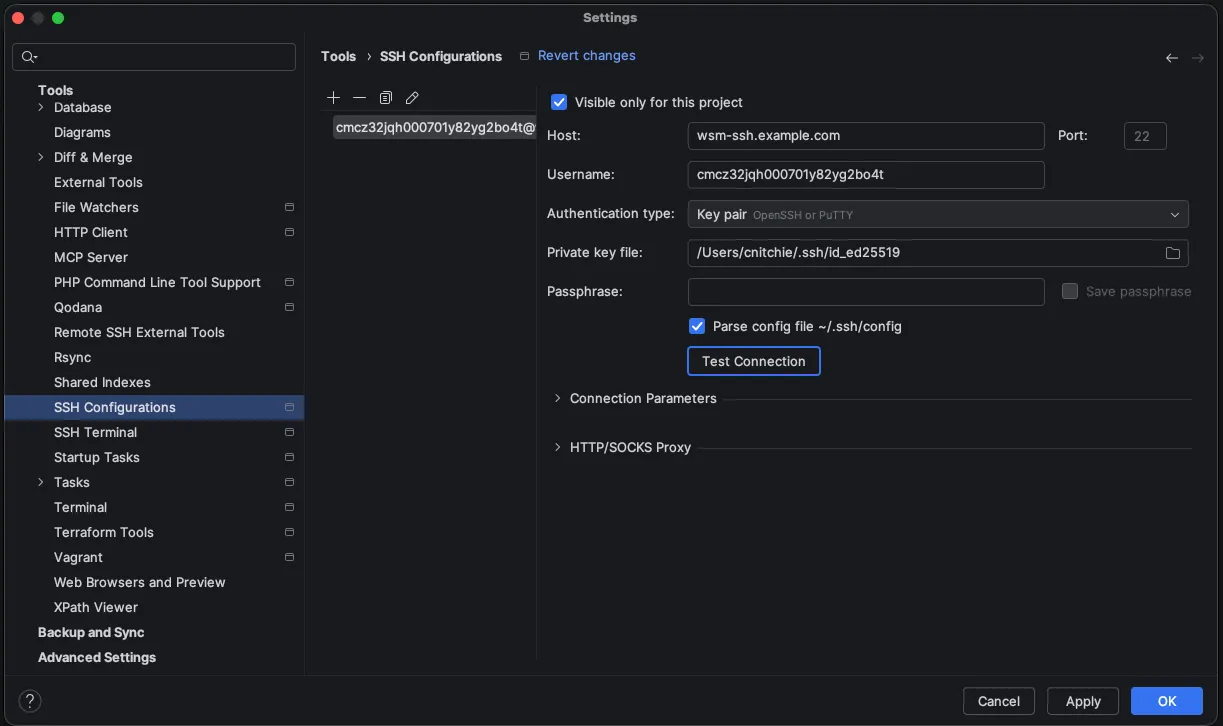
- On your Workspace’s status page, expand the Connecting over SSH help panel. Find the Public SSH Access section, and note the SSH command, e.g.
ssh cmcz32jqh000701y82yg2bo4t@wsm-ssh.example.com.- The part before
@is your workspace’s SSH username -cmcz32jqh000701y82yg2bo4t - The part after the
@is your workspace’s SSH hostname -wsm-ssh.example.com.
- The part before
- Open your JetBrains IDE
- Go to Settings/Preferences → Tools → SSH Configurations
- Click the + button to add a new SSH configuration
- In the Host field, specify the SSH hostname found above (This will be the same for every workspace on your Workspace Manager server).
- In the Username field, specify the workspace’s SSH username, found above.
- In the Private key file field, specify the absolute path to the private key file on your system that corresponds to any of the public keys you’ve configured for your Workspace Manager profile. See SSH documentation for details.
- If your private key is protected by a passphrase, enter it in the Passphrase field.
- Click the Test Connection button to verify that the configuration is correct.
Step 2: Configure SSH Deployment
Section titled “Step 2: Configure SSH Deployment”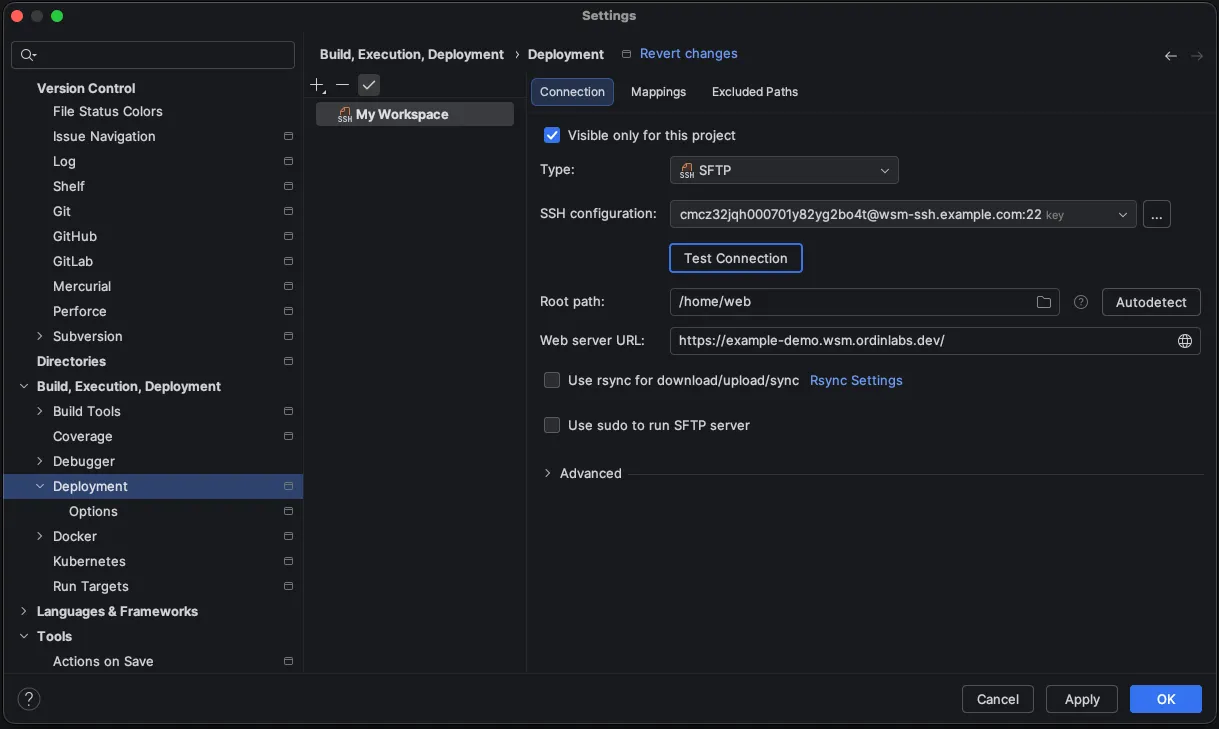
- Open your JetBrains IDE
- Go to Settings/Preferences → Build, Execution, Deployment → Deployment
- Click the + button to add a new deployment configuration
- Select SFTP as the type
- Name your configuration (e.g., “My Workspace”)
- Configure connectivity
- Type: SFTP
- SSH Configuration: The configuration you created in the previous step.
- Root Path: Set to the root path of the application in the workspace, e.g.
/home/web/project. - Web server URL: Set to the URL of your workspace.
- Use the Test Connection button to ensure connectivity.
Step 3: Configure Path Mappings
Section titled “Step 3: Configure Path Mappings”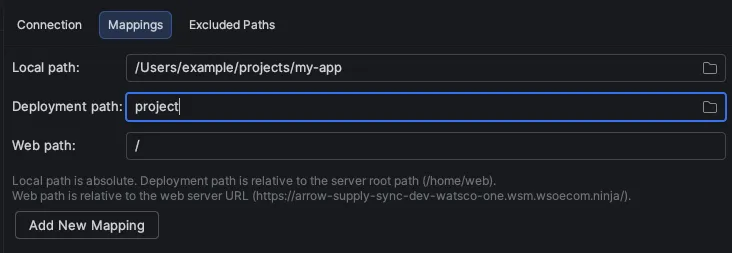
In the Mappings tab:
- Local path: Your project root directory (probably already populated)
- Deployment path: The directory containing project files in the server, relative to the home directory (/home/web), not the absolute path (e.g.,
project, NOT/home/web/project). - Web path:
/
Step 4: Configure Automatic Upload
Section titled “Step 4: Configure Automatic Upload”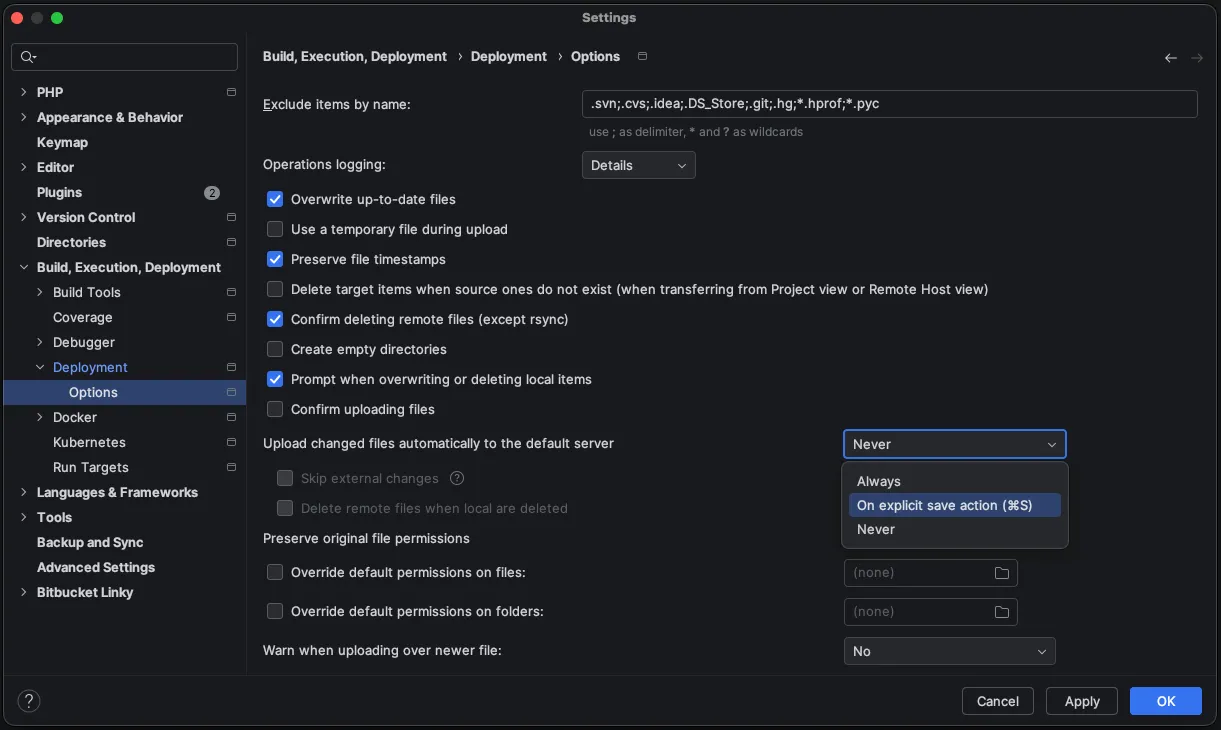
To automatically sync files when you save:
- Go to Settings/Preferences → Build, Execution, Deployment → Deployment → Options
- Set Upload changed files automatically to the default server: On explicit save action
- Optionally enable Upload external changes to sync files modified outside the IDE
Step 5: Start Developing
Section titled “Step 5: Start Developing”You’re now ready to develop remotely:
- Edit files locally - they’ll sync automatically
- Debugging works with remote processes using SSH port forwarding
- Terminal can connect to remote workspace
Deployment Tools
Section titled “Deployment Tools”Manual Upload/Download
Section titled “Manual Upload/Download”Right-click on files or folders:
- Deployment → Upload to [server name]
- Deployment → Download from [server name]
- Deployment → Sync with Deployed to [server name]
Compare with Remote
Section titled “Compare with Remote”- Deployment → Compare with Deployed Version on [server name]
- View differences between local and remote files
- Merge changes as needed
Working with Remote Interpreters
Section titled “Working with Remote Interpreters”Node.js (WebStorm)
Section titled “Node.js (WebStorm)”Remote Node.js interpreter:
- Uses remote npm/yarn for package management
- Runs scripts defined in package.json remotely
- Debugs Node.js applications on workspace
PHP and Xdebug (PhpStorm)
Section titled “PHP and Xdebug (PhpStorm)”PhpStorm can debug PHP applications running on remote workspaces using Xdebug over SSH port forwarding.
Prerequisites
Section titled “Prerequisites”- Xdebug installed and configured on the remote workspace
- SSH deployment configured (see steps above)
- Port forwarding enabled
Configure Xdebug on Remote Workspace
Section titled “Configure Xdebug on Remote Workspace”Ensure Xdebug is configured on your workspace. Add these settings to ~/html/.user.ini:
xdebug.client_host=127.0.0.1xdebug.client_port=9003xdebug.start_with_request=1xdebug.log=/home/web/logs/xdebug.logThe key is setting client_host to 127.0.0.1 since we’ll use SSH port forwarding.
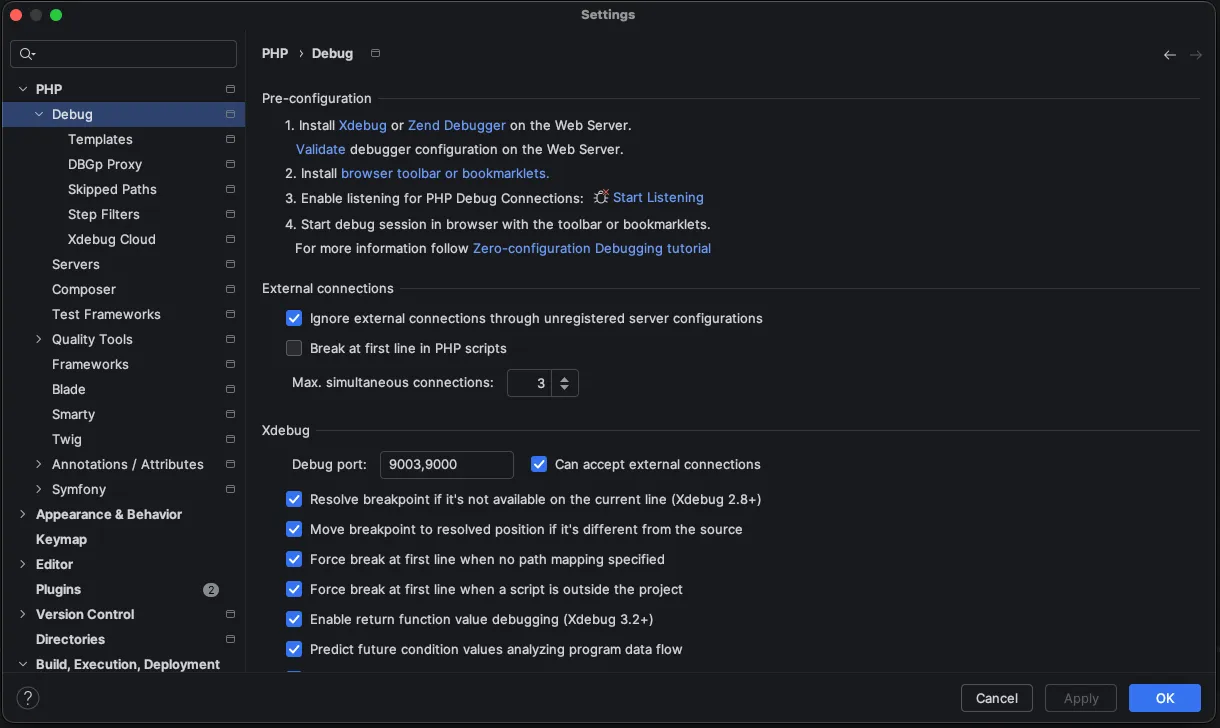
Configure PhpStorm Debug Settings
Section titled “Configure PhpStorm Debug Settings”- Go to Settings → PHP → Debug
- Set Debug port:
9003(or your Xdebug port) - Enable Can accept external connections
- Optionally disable Break at first line in PHP scripts for cleaner debugging
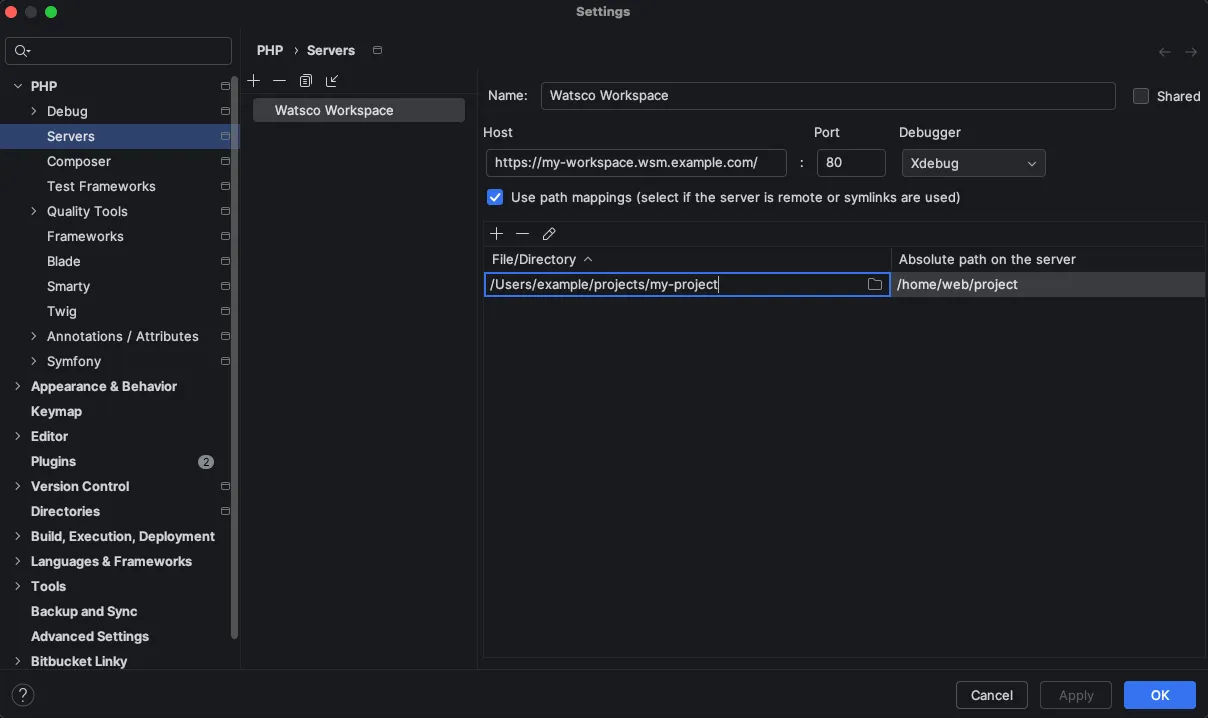
Configure Path Mappings
Section titled “Configure Path Mappings”- Go to Settings → PHP → Servers
- Click + to add a new server
- Set Name: Your workspace name
- Set Host: Your workspace hostname
- Enable Use path mappings
- Map your local project root to the remote path (e.g.,
/home/developer/project)
Start Debugging
Section titled “Start Debugging”- Open an SSH tunnel to forward the Xdebug port from the workspace back to your local machine:
Keep this terminal open while debugging.
Terminal window ssh -NR 9003:localhost:9003 cmcz32jqh000701y82yg2bo4t@wsm-ssh.example.com - Click the Start Listening for PHP Debug Connections button (phone icon) in the toolbar
- Set breakpoints in your PHP code
- Trigger your PHP application (via browser, CLI, etc.)
- PhpStorm will pause at your breakpoints
Troubleshooting Xdebug
Section titled “Troubleshooting Xdebug”Xdebug not connecting:
- Verify port forwarding is active:
ssh -R 9003:localhost:9003 wsm.my_workspace - Check Xdebug is loaded:
ssh wsm.my_workspace "php -v"(should show Xdebug) - Verify Xdebug settings:
ssh wsm.my_workspace "php -i | grep xdebug" - Check PhpStorm is listening (phone icon should be green)
- Verify firewall isn’t blocking port 9003
Breakpoints not hit:
- Verify path mappings are correct
- Check that Xdebug
client_hostis set to127.0.0.1 - Ensure
xdebug.start_with_request=yesis set - Try adding
XDEBUG_SESSION=1to your request
Connection timeout:
- Check SSH tunnel is active
- Verify remote Xdebug port matches local port (9003)
- Test port forwarding:
ssh -R 9003:localhost:9003 wsm.my_workspace "nc -zv 127.0.0.1 9003"
Other Languages
Section titled “Other Languages”Similar remote interpreter/SDK configuration available for:
- Ruby (RubyMine)
- Go (GoLand)
- C/C++ (CLion)
Port Forwarding
Section titled “Port Forwarding”JetBrains IDEs automatically handle port forwarding for remote development:
- When you run a web server or service on the remote workspace
- The IDE detects the port and offers to forward it
- Click the notification to open in your local browser
- Access remote services as if they were local
You can also manually configure port forwarding:
- Tools → Deployment → Configuration → SSH tab
- Add port forwarding rules as needed
See Port Forwarding documentation for more details.
File Sync Best Practices
Section titled “File Sync Best Practices”- Enable automatic upload: Ensures remote files stay in sync
- Use explicit save: Prevents excessive sync operations
- Review sync conflicts: Check for conflicts before overwriting
- Sync before running: Ensure latest code is deployed before execution
Troubleshooting
Section titled “Troubleshooting”Cannot Connect to Remote Host
Section titled “Cannot Connect to Remote Host”Symptoms: Connection timeout or refused
Solutions:
- Verify workspace is running in WSM dashboard
- Test SSH connection from terminal:
ssh wsm.my_workspace - Update SSH config:
wsm-cli ssh config-update - Check firewall settings
- Verify SSH key is added to WSM profile
Authentication Failed
Section titled “Authentication Failed”Symptoms: Permission denied (publickey)
Solutions:
- Verify SSH key path in IDE settings
- Check key permissions:
chmod 600 ~/.ssh/id_ed25519 - Ensure key is added to WSM profile
- Test key with:
ssh -i ~/.ssh/id_ed25519 wsm.my_workspace - Check SSH agent is running:
ssh-add -l
Files Not Syncing
Section titled “Files Not Syncing”Symptoms: Changes not appearing on remote workspace
Solutions:
- Check automatic upload is enabled
- Manually upload: Right-click → Deployment → Upload
- Review excluded paths in deployment settings
- Check deployment logs: Tools → Deployment → View Deployment Logs
- Verify path mappings are correct
Port Forwarding Not Working
Section titled “Port Forwarding Not Working”Symptoms: Cannot access remote web services
Solutions:
- Verify service is running on remote workspace
- Check port forwarding settings in deployment configuration
- Manually add port forwarding rule
- Test port forwarding from terminal:
ssh -L 8080:localhost:8080 wsm.my_workspace - Check firewall rules on workspace
Gateway Connection Issues
Section titled “Gateway Connection Issues”Symptoms: Cannot establish connection
Solutions:
- Ensure SSH connection works from terminal first
- Verify workspace has sufficient resources
- Check network connectivity and firewall settings
Slow Performance
Section titled “Slow Performance”Symptoms: IDE is sluggish, file operations are slow
Solutions:
- Exclude large directories from sync (node_modules, build, etc.)
- Use Gateway instead of file sync for large projects
- Disable unnecessary plugins
- Increase IDE memory: Help → Change Memory Settings
- Check network latency to workspace
Host Key Verification Failed
Section titled “Host Key Verification Failed”Symptoms: Host key has changed warning
Solutions:
- Remove old host key:
ssh-keygen -R wsm.my_workspace - Reconnect and accept new host key
- Update known_hosts file
- Verify workspace hasn’t been recreated (new host key)
Advanced Configuration
Section titled “Advanced Configuration”Custom SSH Options
Section titled “Custom SSH Options”Add custom SSH options in deployment configuration:
- Go to Settings → Deployment → Configuration
- Select your deployment → SSH tab
- Add custom SSH options as needed
Multiple Workspaces
Section titled “Multiple Workspaces”Configure multiple deployment configurations for different workspaces:
- Create separate deployment configurations for each workspace
- Set one as default for automatic operations
- Switch between configurations as needed
- Use different run configurations for different workspaces
Shared Team Settings
Section titled “Shared Team Settings”Share deployment configurations with your team:
- Export deployment settings: File → Manage IDE Settings → Export Settings
- Commit
.idea/deployment.xmlto version control (remove sensitive data) - Team members import settings or check out from VCS
Related Documentation
Section titled “Related Documentation”- SSH Access - Configure SSH keys and connection
- Connecting Visual Studio Code - VS Code remote development
- Port Forwarding - Forward ports from workspaces
- Automatically Syncing Files - Automatic file synchronization with Mutagen or rsync